DESCRIPTION
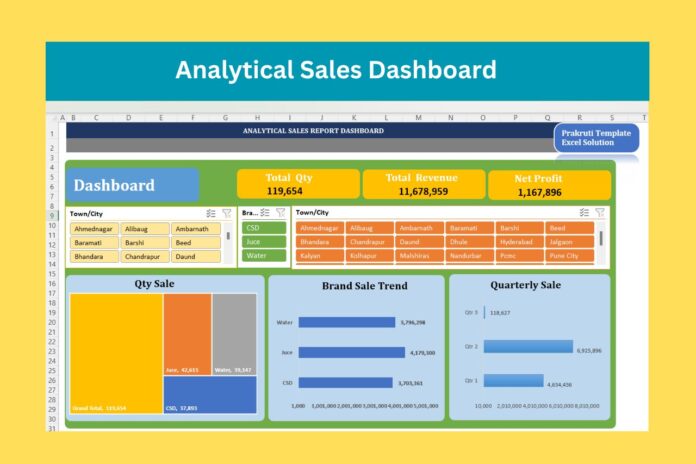
This Analytical Dashboard shows the condition of sales in simple language. In this, critical big data is easily shown in short form through chart, slicer. With the help of this dashboard, you can present your sales report in a easy & beautiful manner.
KEY FEATURES OF ANALYTICAL SALES REPORT DASHBOARD
♦ Easy to Understand
♦ Easy Dynamic Excel Format
♦ Easy to Download Excel File
♦ Digital File
♦ 100% fully customizable template
Short Description of Analytical Sales Report Dashboard
It is very easy to create a dashboard in Excel. You just need practice. In this sales report, we have taken sales data and linked them to each other through charts and slicers. So that the user can easily see his result by clicking on the slicer.
See Short Step..
Step 1 : Create Format for Dashboard
Step 2 : Make Box for require category image
Step 3 : Create Category Wise Chart. Like this…


Step 4 : Make slicer by category wise.. Like this

All these steps are very simple. This user-free dashboard is editable. You can make your own dashboard by making changes in it.
Download Analytical Sales Dashboard in Excel
Also more Learn & Make Dashboard :
Excel Dashboard Using Analytical Sales Trend
Donate Money as you wish
“Thank you for your generous donation!” The donation we receive from you motivates us to work harder.
The reason behind asking for donation is that we have to work hard to make the product. We also have to give more time for this. That is why we ask you to donate as per your wish.

