DESCRIPTION
If you want to create a smart sales dashboard for the company’s Annual Meeting or other working. And for this, you are looking for Excel sales dashboard on the Internet. So this sales dashboard of ours can be very useful for you. You can edit this Excel template easily. You can make changes in it as you want.
Let us understand a little about the work of dashboard. Dashboard is a smart data visualization process. With this process, you can give an overview of large data in short. This Smart dashboard is enough for the management team to understand in a simple way.
Our dashboard will teach you very well about sales trend. In this, raw data has been provided for you to understand. With this you can create your own smart report by editing the data.
KEY FEATURES OF ANALYTICAL SALES TREND DASHBOARD
♦ Easy to Understand
♦ Easy Dynamic Excel Format
♦ Easy to Download Excel File
♦ Digital File
♦ 100% fully customizable template
Analytical Sales Trend Excel Dashboard
Make this easy step to create dashboard
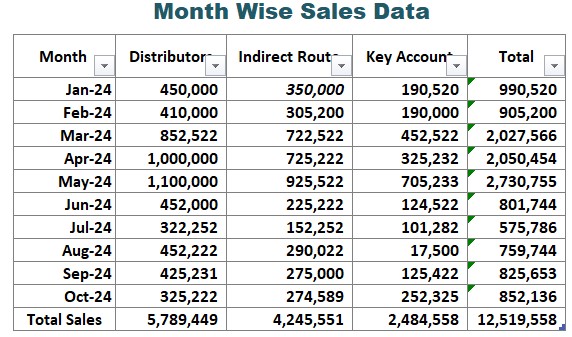
Step 1 > Create Analytical Sales Data.. Like this

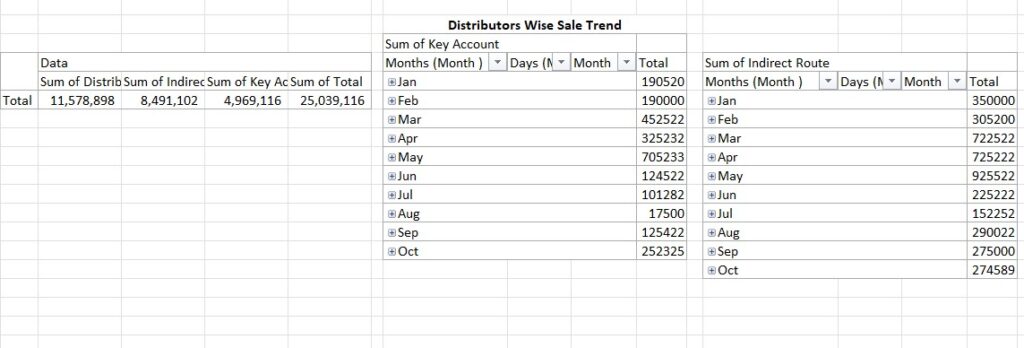
Step 2 > Place a pivot table on the sales data. After that, you can prepare a Category wise chart using Pivot Table. Like this..
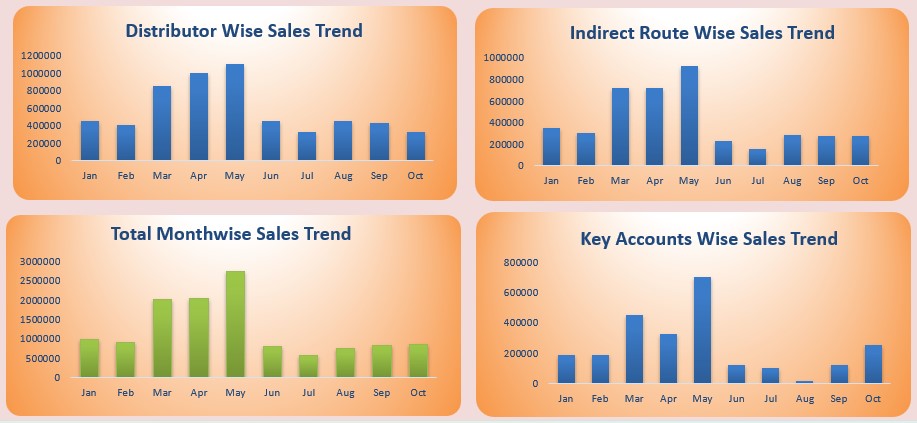
Step 3 > After using pivot table create chart like this

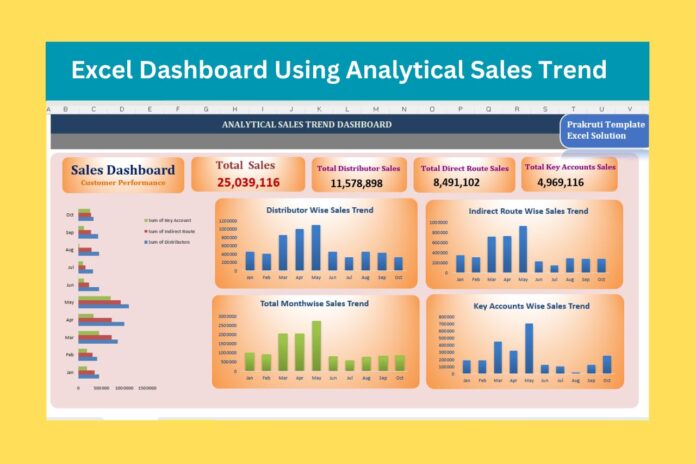
Step 4 > Doing all Pivot table & charts, make sales dashboard. For this, we have created Excel Sales Dashboard. You can easily download this Excel file. And this file is 100% fully customizable.
Download Excel Dashboard Using Analytical Sales Trend
Donate Money as you wish
“Thank you for your generous donation!” The donation we receive from you motivates us to work harder.
The reason behind asking for donation is that we have to work hard to make the product. We also have to give more time for this. That is why we ask you to donate as per your wish.


