
Template Description:
Smart Sales Sidebar Dashboard Report in Excel is a fully self-designed, dynamic sales analytics solution built to deliver instant business insights. This Excel dashboard includes a visually appealing cover, interactive main dashboard, month-wise sales analysis, executive-wise performance, and product-wise sales tracking. It also features advanced forecasting reports, moving sales trend analysis, and automatic direct linking between sheets for seamless navigation. Designed for accuracy, speed, and clarity, this smart sales dashboard helps management monitor performance, identify growth opportunities, and make data-driven decisions efficiently—all within a powerful, easy-to-use Excel interface.
Features of Smart Sales Sidebar Dashboard Report
♦ Useful in all business
♦ Easy to understand and editable
♦ Data Available with examples
♦ You will learn many important Excel formulas
♦ Used a lot in multinational companies
♦ Dynamic Excel Digital Format
♦ Easy to Download file
Below is a clear, step-by-step explanation of the Smart Sales Sidebar Dashboard Report in Excel, written so users can easily understand how the report works.
Smart Sales Overview: Sidebar Dashboard Report
Step 1: Cover Sheet
The cover sheet presents the report title “Smart Sales Sidebar Dashboard Report”, along with company details and the reporting period.
It gives a professional overview and sets the context for the entire report.
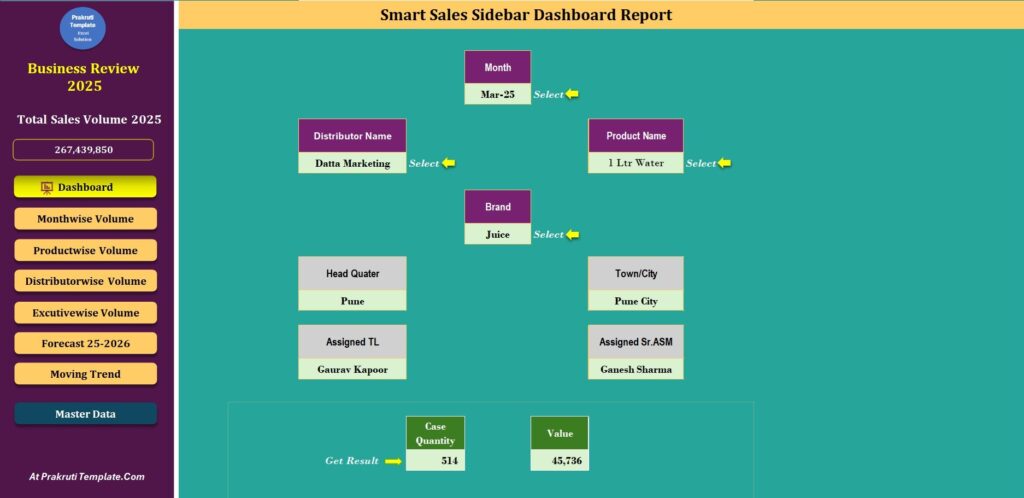
Step 2: Main Dashboard
This is the central view of the report.
It displays key performance indicators (KPIs) such as total sales, revenue, quantity sold, and growth percentage using charts and visuals.
The sidebar allows quick navigation to all report sections.
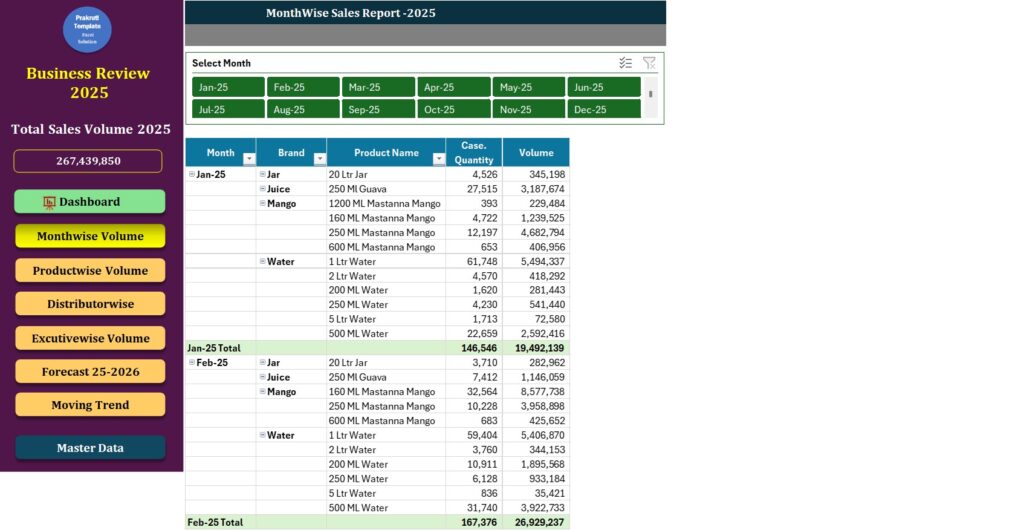
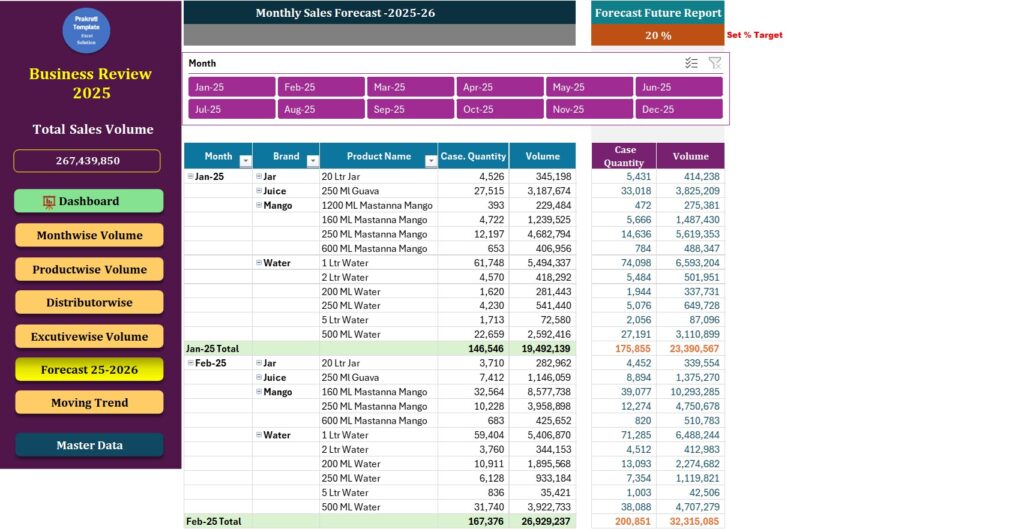
Step 3: Month-wise Sales Analysis
This section shows sales performance for each month.
Graphs and trend lines help users identify seasonal patterns, peak months, and low-performing periods.
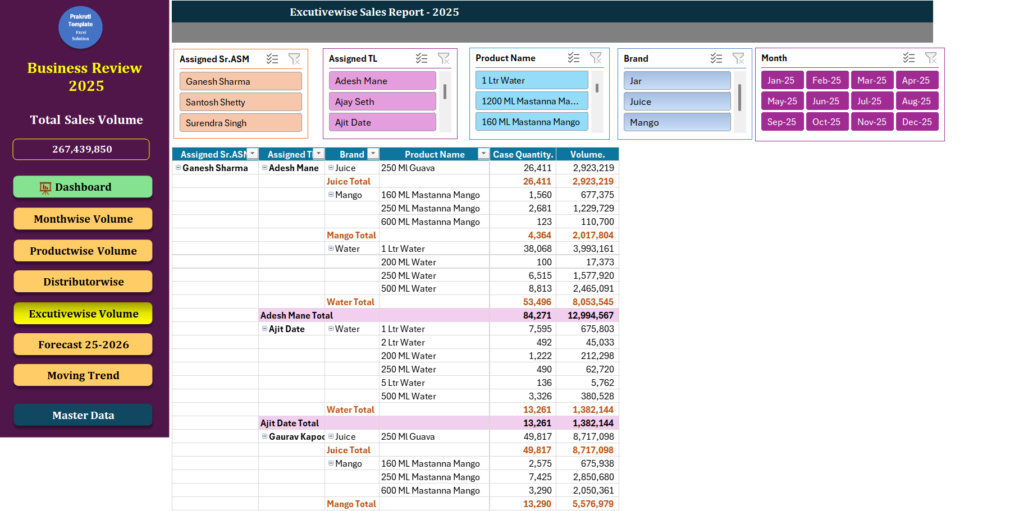
Step 4: Executive-wise Sales Report
Here, sales performance is analyzed by individual sales executives.
It helps management compare performance, track targets, and evaluate team efficiency.
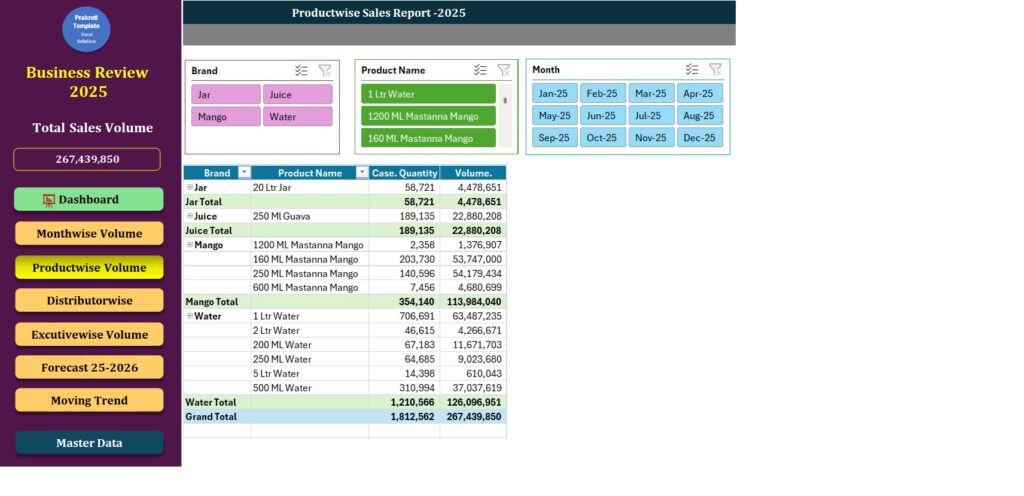
Step 5: Product-wise Sales Report
This report breaks down sales by product.
It highlights top-selling and low-performing products, supporting inventory and marketing decisions.
Step 6: Forecast Report
The forecast report predicts future sales based on historical data.
It supports better planning, budgeting, and goal setting.
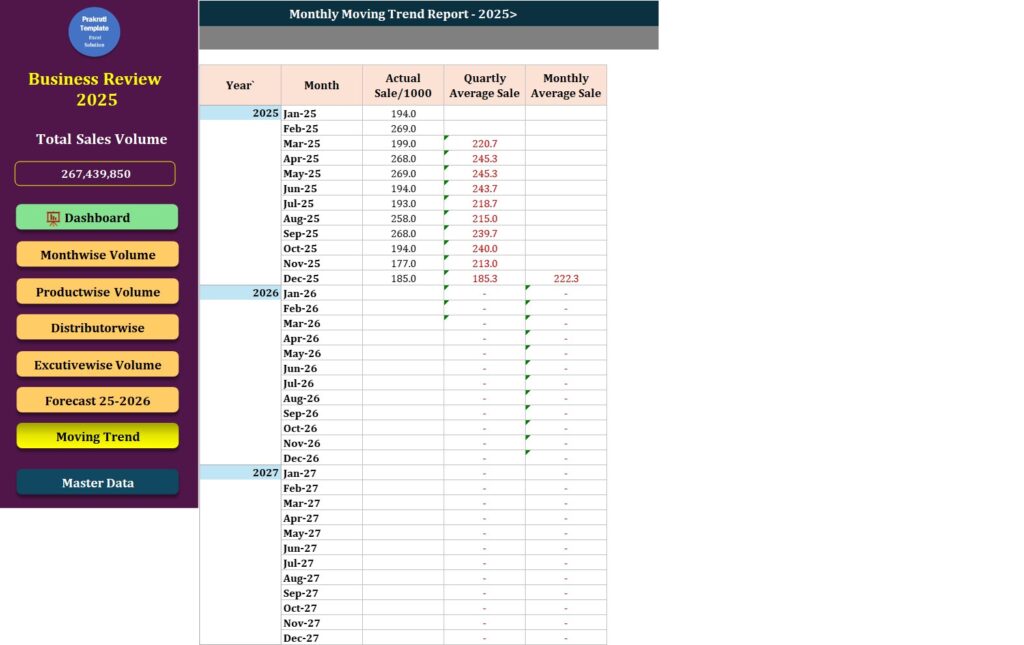
Step 7: Moving Trend Analysis
Moving trend charts show the overall sales direction over time.
They help identify long-term growth patterns or declines.
Step 8: Automatic Direct Linking
All sheets are automatically connected.
With one click from the sidebar or dashboard, users can navigate instantly to any report, making the dashboard fast, interactive, and user-friendly.
Learn from Video
Buy our own designed Smart Sales Sidebar Dashboard Report to track sales performance effortlessly. This interactive Excel dashboard offers real-time insights, automated linking, clear visuals, and smart analysis for faster, data-driven business decisions.
Download Premium Smart Sales Sidebar Dashboard Report.Xls
PayPal for Other Country
Instamojo for India
Also Check & Download Templates
Sales Analysis Template in Excel | Sales Report | Free Download
CRMS Excel Template | Sales and Relationship Dashboard
Sales Trend Excel Template | Free Download
Smart Sales Report Excel Templates | Free Download
Consolidated Daily Sales Report in Excel
Hospital Business Analytical Report in Excel
Company Asset Sales & Survey Report
Easy to Use Quarterly Sales Chart Dashboard
Daily Sales Report Dashboard : Track, Analyze, and Grow Your Business